Review of 2015
The US economy and broad market showed modest gains during the year, although investor discipline was tested by news of a global economic slowdown, rising market volatility in China and emerging markets, falling oil and commodities prices, and higher US interest rates.
The S&P 500 Index logged a 1.38% total return. The returns across US indices were mixed, but overall the broad US market, as measured by the Russell 3000, gained 0.48%—its lowest return since the 2008 market downturn. The Nasdaq Composite Index returned 6.96%. Performance among non-US markets was mostly negative: The MSCI World ex USA Index logged a ‒3.04% total return and the MSCI Emerging Markets Index a ‒14.92% return (net dividends, in USD). The US dollar’s strong performance against major currencies resulted in lower returns for US investors in various markets. For example, the MSCI All Country World Index returned 1.27% in local currency but ‒2.36% in USD (net dividends).
In December, the Federal Reserve announced that it would raise its target range for the federal funds rate from 0.25% to 0.50%, ending a seven-year period of close-to-zero rates. As of year-end, the yield on the benchmark 10-year Treasury note stood at 2.27%, only slightly up from 2.17% in 2014. The Barclays US Government Bond Index returned 0.86% and Barclays US Intermediate Corporate Index returned 1.08%. Global government bonds had slightly positive returns with the Citigroup World Government Bond 1–5 Year Index (USD hedged) returning 1.00%. Global corporate bonds also had positive returns, with the Barclays Global Aggregate Corporate Bond Index 1–5 Years (hedged to USD) returning 1.21%.

The chart above highlights some of the year’s prominent headlines in context of broad US market performance, measured by the Russell 3000 Index. These headlines are not offered to explain market returns. Instead, they serve as a reminder that investors should view daily events from a long-term perspective and avoid making investment decisions based solely on the news.
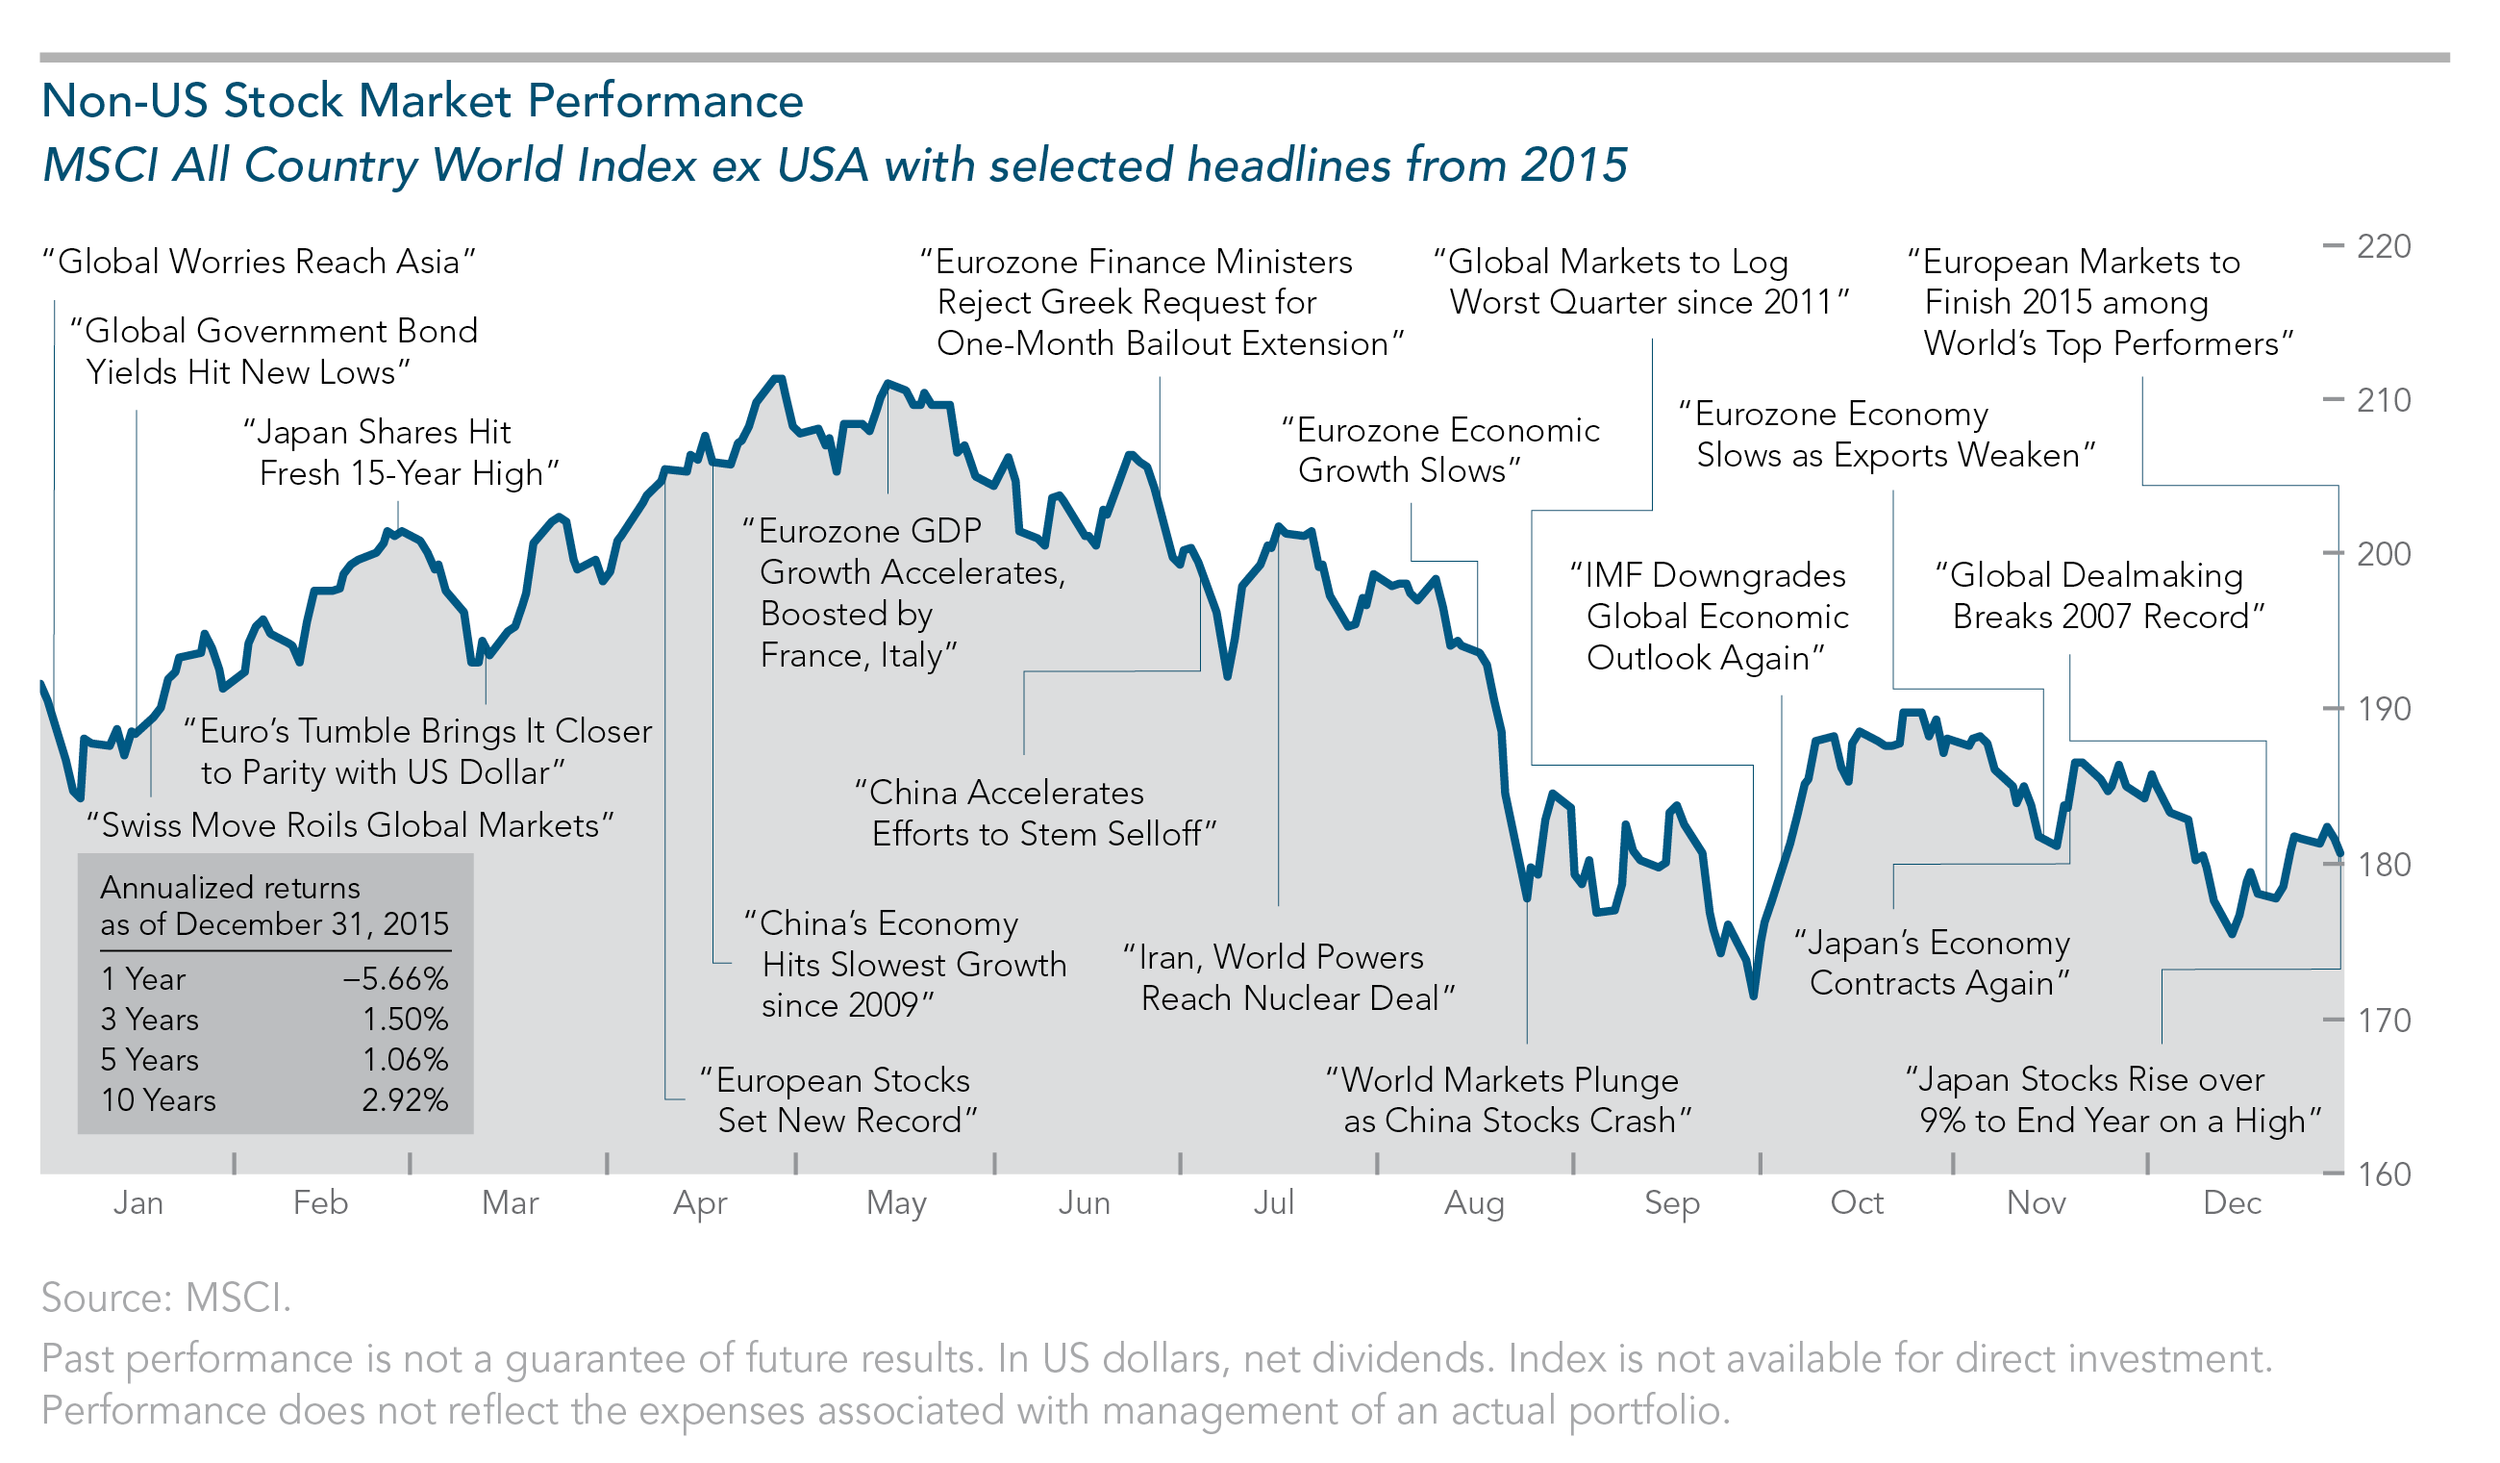
The chart below offers a snapshot of non-US stock market performance (developed and emerging markets), measured by the MSCI All Country World ex USA Index (in USD, net dividends). The headlines should not be viewed as determinants of the market’s direction but as examples of events that may have tested investor discipline during the year.
Global Backdrop
US Economy
The US economy grew modestly during 2015. Gross domestic product (GDP) increased only 0.6% in Q1 before improving to 3.9% in Q2 (year over year). Growth slowed to 2.0% in Q3. Q4 GDP growth was forecasted to decline to 1.0% and GDP growth for all of 2015 to average 2.5%.
Positive economic signs in 2015 included lower unemployment, which fell from 5.7% in January to 5.0% in the last three months of the year—the lowest rate since 2008. Overall, the economy added 2.7 million jobs, capping the second-best annual gain since 1999. December wages were up 2.5% (year over year), which marked one of the best gains of the current expansion. Low oil prices helped keep overall inflation low. The all items consumer price index (CPI) rose 0.7% in 2015, although core CPI, which excludes food and energy, increased 2.1%. US housing activity remained solid with price growth, as measured by the S&P/Case-Shiller Home Price Index, rising 5.2% (year over year) through October. New home sales increased 14.5% through November. Consumer confidence also improved, with the University of Michigan’s Index of Consumer Sentiment averaging 92.9 in 2015—the highest since 2004. Consumer spending, which accounts for more than two-thirds of US economic activity, grew 3.0% in Q3.
Negative economic indicators included declining US factory activity. In December, the Institute for Supply Management’s (ISM) index fell to 48.2 from 48.6 in November, which was the weakest reading since the final month of the recession in June 2009. (Readings below 50 indicate contraction.) Corporate profits declined in Q1 and Q3 by 5.8% and 1.6%, respectively.
Global Economy
In 2015, economic growth was the weakest since the financial crisis. In December, the Organization for Economic Cooperation and Development (OECD) revised its 2015 world growth estimate downward to 2.9%—well below the historical average of 3.6% per year.
Eurozone GDP growth increased 0.5% in Q1, which was the strongest quarterly rate since its regional recovery began in early 2013. But the pace slowed to 0.4% in Q2 and to 0.3% in Q3. The slowdown came in spite of improved consumer spending sparked by lower energy prices and the European Central Bank’s (ECB) quantitative easing efforts. A decline in the euro’s value boosted exports and contributed to an improved current account surplus (3.7% of GDP) in 2015. Japan’s economy showed signs of improvement early in 2015 by posting a 3.9% GDP growth rate in Q1. Growth in Q2 reversed with a –0.7% rate before rebounding to 1% in Q3.
China, the world’s second largest economy, showed signs of a slowdown during 2015, with Q1 and Q2 growth reported at 7% and Q3 growth falling to 6.9%. The Chinese government later revised its growth target to 6.5%, reflecting the weakest growth in 25 years. Slower growth extended to other emerging markets. In Q4, the International Monetary Fund (IMF) cut its 2015 growth estimate for emerging markets to 4%, which marked the fifth consecutive year of declining growth.
Oil Market Decline
The world oil market continued its dramatic slide. After falling more than 50% in 2014, oil declined another 30% to end 2015 at $37.04 a barrel for West Texas intermediate crude, marking the largest two-year price drop on record. Factors affecting the price decline include excess supply spurred in part by higher production in North America, Middle East, and Russia, and slack demand due to slowing global growth, especially in the emerging markets. The steep price decline brought uncertainty to financial markets and industry sectors as firms curtailed spending and canceled projects, and oil-exporting countries collected lower tax revenues and struggled with the effects of a weaker currency.
Diverging Paths for Central Banks
The divergence in actions by the major central banks in 2015 marked the first time since the euro’s launch that the Fed, ECB, and Bank of England have set course on different monetary paths as a result of diverging economies. In the late 1990s, the booming global economy led the central banks to apply rate hikes, while the 2001–2003 market decline brought similarly timed rate cuts.
In September, the Fed postponed raising interest rates, citing concerns with the economy, inflation, and worldwide market volatility. The central bank raised its benchmark rate by a quarter point in December—its first rate hike since 2006—and stated that it would continue on a gradual course of monetary tightening as long as inflation and economic growth allowed. The impact on the US financial markets was negligible, as rates had already begun to increase in anticipation of the move. Even as the US central bank began monetary tightening, most banking authorities across the globe were taking measures to ease their country’s monetary policy in response to signs of an economic slowdown. The ECB implemented a major stimulus program throughout the year, and in December announced new quantitative easing measures along with Japan.
2015 Investment Overview
Market Summary
In the US equity markets, most major indices logged negative performance, despite a strong rebound during Q4. For the year, the S&P 500 Index returned 1.38%; the Russell 3000 Index 0.48%; and the Russell 2000 Index ‒4.41%.
US market volatility, measured by the Chicago Board Options Exchange Market Volatility Index (VIX), declined steadily for the first half of 2015, but jumped to its highest level in six years in late August, following the US market decline. During Q4, the index dropped then rose again to close slightly higher for the year.
Non-US developed stock markets experienced mixed performance across almost all major indices (returns in USD, net dividends). The MSCI World ex USA Index, a benchmark for large cap stocks in developed markets outside the US, returned ‒3.04%. Small cap and value stock returns were mixed: The MSCI World ex USA Small Cap Index returned 5.46% and MSCI World ex USA Value Index returned ‒7.68%. The MSCI World ex USA Growth Index was positive at 1.65%. Emerging markets were among the worst global performers: The MSCI Emerging Markets Index returned ‒14.92%; the small cap subindex returned ‒6.85%; the value subindex returned ‒18.57%.
Among the equity markets tracked by MSCI, nearly half of the countries in the non-US developed markets index had negative total returns (in USD) and the range of returns was broad. The top three return countries were Denmark (23.43%), Ireland (16.49%), and Belgium (12.10%). Countries with the lowest returns were Canada (‒24.16%), Singapore (‒17.71%), and Spain (‒15.64%).
In emerging markets, 21 of 23 countries tracked by MSCI logged negative total returns (in USD) and the dispersion of returns was broader than in the developed countries. Hungary (36.31%), Russia (4.21%), and India (‒6.12%) were the top-performing countries in the index. The lowest returns in the index came from Greece (‒61.33%), Colombia (‒41.80%), and Brazil (‒41.37%).
Returns of major fixed income indices were slightly positive. One-year US Treasury notes returned 0.15%, Barclays US Government US Bond Index 0.86%, Citigroup World Government Bond Index (1‒5 years, USD hedged) 1.00%, and Barclays US TIPS index returned ‒1.44%. The Barclays Global Aggregate Corporate Bond Index 1–5 Years (hedged to USD) returned 1.21%.
US and global real estate securities had mixed performance: The Dow Jones US Select REIT Index returned 4.48%, and the S&P Global ex US REIT Index returned ‒3.54%. Commodities were negative for the fifth year in a row, with the Bloomberg Commodity Total Return Index returning ‒24.66%. Among the composite indices, petroleum returned ‒39.42% and industrial metals ‒26.88%. Among the single commodity indices, Brent crude (‒45.57%) and West Texas intermediate crude (‒44.35%) were the worst performers. Natural gas returned ‒39.95%. Gold was down for the third year in a row at ‒10.88%; silver prices returned ‒12.72%. Cotton was the only commodity in the index to post a positive return (2.97%).
Currency Impact
The US dollar rose against most major currencies, including the euro, pound, and yen. The dollar’s strength had a negative impact on returns for US investors with holdings in unhedged non-US assets. For example, in 2015, the dollar’s rise relative to the euro hurt the returns of US investors in European markets. The MSCI Europe Index (net dividends) returned 8.22% in euro but ‒2.84% in US dollars. This was the case in other regions where the dollar outperformed local currencies. Examples: The MSCI United Kingdom Index (net dividends) returned ‒2.21% in pounds and ‒7.56% in USD. The MSCI Australia Index returned 1.29% in Australian dollars but ‒9.95% in USD.
Performance of Size and Value Premiums
Based on the respective total returns of the Russell indices1 within the size dimension, US small cap stocks underperformed US large cap stocks by ‒5.33% (‒4.41% vs. 0.92%). Within the relative price dimension, US value underperformed US growth by ‒9.22% (‒4.13% vs. 5.09%). Among US small cap stocks, small value underperformed small growth by ‒6.09% (‒7.47% vs. ‒1.38%); among US large cap stocks, large value underperformed large growth by ‒9.49% (‒3.83% vs. 5.67%).
As in most years, diverging performance of various subindices in 2015 underscores the fact that the premium within a particular dimension (e.g., size or value) does not always move in the same direction across the global markets. For example, although the size premium was negative in the US, it was positive in both the developed non-US and emerging markets for the year. The MSCI World ex USA Small Cap Index outperformed the MSCI World ex USA Index by 8.50% (all returns in USD, net dividends). The MSCI Emerging Markets Small Cap Index outperformed the MSCI Emerging Markets Index by 8.07%. Value premiums outside the US were generally negative. The MSCI World ex USA Value Index underperformed its growth counterpart by ‒9.33%; the MSCI Emerging Markets Value Index underperformed the MSCI Emerging Markets Growth Index by ‒7.24%.
Annual underperformance of the size and value premiums is not unusual from a historical standpoint. Although small cap and value stocks have offered higher expected long-term returns relative to their large cap and growth counterparts, these return premiums do not appear each year.1 For example, since 1979, US small caps have outperformed large caps in 19 of the 37 calendar years—or 51% of the time. Results are similar for the relative price dimension. Since 1979, US value has outperformed growth in 20 of 37 calendar years—or 54% of the time. Small cap value has outperformed small cap growth in 57% of the calendar years.
History also has produced multiyear periods in which US small cap and value stocks did not outperform large caps and growth. The most recent example is three-year underperformance of small cap value vs. small cap growth (2013‒2015). Small value has also underperformed in three straight years (2009‒2011 and 1989‒1991). Other multiyear examples include small caps underperforming large caps (1984‒1987 and 1994‒1998) and value underperforming growth (1989‒1991 and 2009‒2011). Yet, despite even extended negative-premium periods, small cap and value stocks have outperformed their counterparts over time, and when the premiums reversed, they often did so strongly and for multiple years.

